 Off the charts
Writing a map library from scratch - Part 1: Basics
One day, as I embarked on the journey to improve a website’s performance, I stumbled upon this lighthouse report:
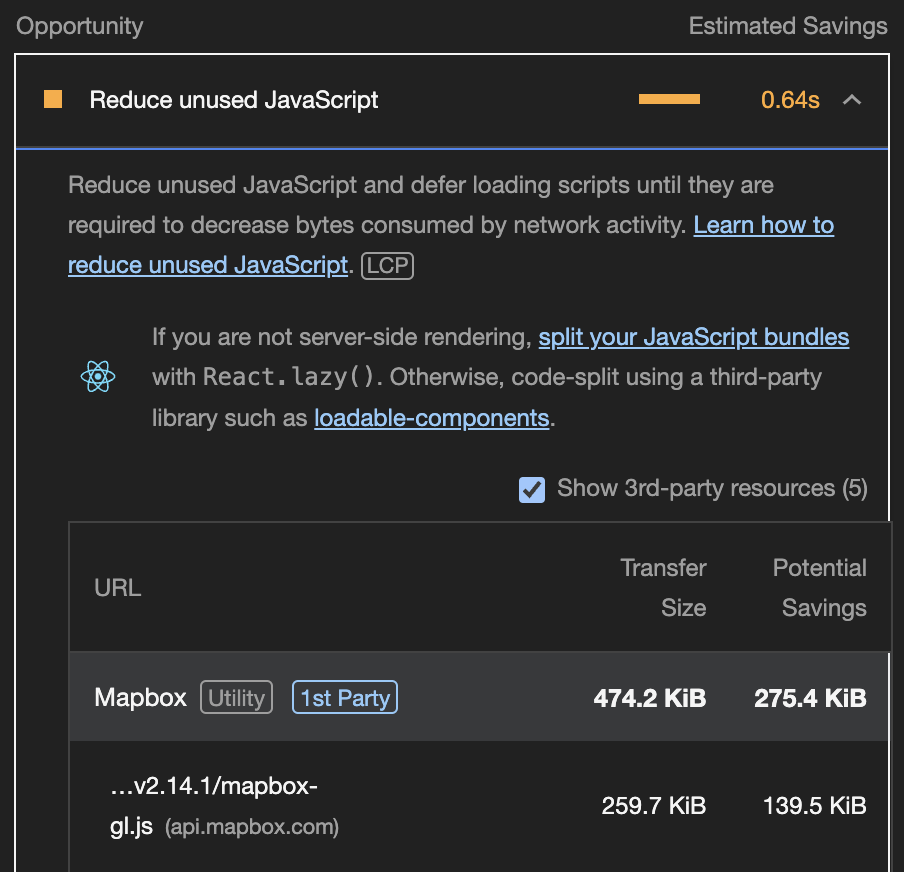
And I thought, why is the mapbox-gl.js library ~260kB big?
I just need to display a small map with a couple of markers! Why do I need 260kB for that?
I wondered, is this just mapbox? Or are all map libraries this big?
I was surprised to see that even the smallest library, Leaflet, was still 45kB big. Also, how come, with the rise of Server-Side Rendering (SSR) and Static Site Generation (SSG), neither is available for any of these libraries? How does a map library even work?
I mean, can’t I simply write my own map library?
oh boy.
How does a map library work under the hood?
After a bit of research, I found this great article, by the legendary Volodymir Agafonkin. In a nutshell, a web map is a mosaic of tiles. It uses the Web Mercator projection to represent the earth globe on a flat surface. The amount of tiles is relative to your zoom level and map size.
At zoom level 0, you only need one tile, which will look like this:

Tile at zoom level 0
This tile is 256x256 pixels and generated by OpenStreetMap.
The URL is https://tile.osm.org/0/0/0.png.
The URL parameters are /z/x/y.png, z being the zoom level,
x the xth horizontal tile, and y the yth vertical tile.
On each higher zoom level, the amount of tiles quadruples.
At zoom level 1, you need 4 tiles, which will look like this:
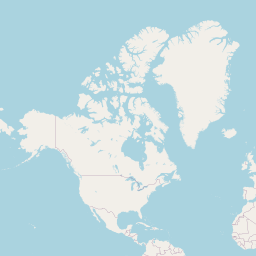
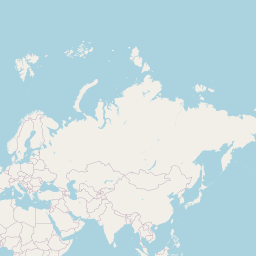
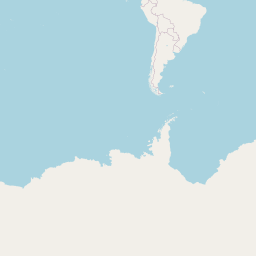
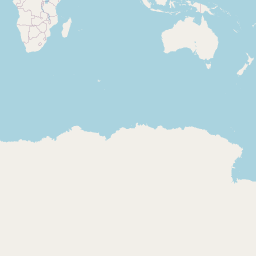
Tiles at zoom level 1
Here, the URL parameters are /1/0/0.png, /1/1/0.png, /1/0/1.png, and /1/1/1.png.
But how do we know which tiles to fetch? And how do we know where to place them?
We’ll start by choosing the center of our map. Let’s say we want to center our map on Berlin, Germany.
We’ll use the latitude/longitude coordinates [52.52, 13.4]1, on zoom level 14.
Also, we’ll try to fit our map in a 400x300 pixels container.
Now, we need to figure out which tiles, using the /z/x/y.png parameters, we need to fetch.
On zoom level 14, the world is divided into 214 = 16,384 x- and y-tiles.
Knowing that one tile has a size of 256 pixels, we can calculate the size of each
axis: axisSize = 16,384 ⋅ 256 = 4,194,304 pixels
on the x- and y-axis.
Now begins the fun part. We need to use the Web Mercator Projection formula to convert our latitude/longitude coordinates (based on a globe) to x/y coordinates (based on a flat surface):
x = axisSize * (longitude / 360 + 0.5);
x = 4194304 * (13.4 / 360 + 0.5);
x = 2253273.3155555557;
y = (axisSize * (1 - Math.log(Math.tan(Math.PI * (0.25 + latitude / 360))) / Math.PI)) / 2;
y = (4194304 * (1 - Math.log(Math.tan(Math.PI * (0.25 + 52.52 / 360))) / Math.PI)) / 2;
y = 1375543.6427981234;Note: The Web Mercator Projection only works for latitudes between 85°N to 85°S.
Since we want to center our latitude/longitude coordinates in the middle of our container, we need to subtract half of the container size from our x/y coordinates:
width = 400;
height = 300;

x0 = Math.floor(x - width / 2);
x0 = 2253073;

y0 = Math.floor(y - height / 2);
y0 = 1375393;
However, x0 and y0 are coordinates in pixels. We still need to convert them to tile coordinates,
i.e. the matching number for the /z/x/y.png parameters.
To do this, we need to floor divide our x0 and y0 by 256:
topLeftCornerTileX = Math.floor(x0 / 256);
topLeftCornerTileX = 8801;

topLeftCornerTileY = Math.floor(y0 / 256);
topLeftCornerTileY = 5372;
Now, we know that we need to fetch the tile /14/8801/5372.png, which is:

Top Left Tile
This seems correct! Let’s fill our container with the adjacent tiles and a bit of css to position it correctly:
result = `<div style="height: ${height}px; position: relative; overflow: hidden;">`
tileSize = 256

for (let tileY = topLeftCornerTileY; tileY * tileSize < y0 + height; tileY++) {
	for (let tileX = topLeftCornerTileX; tileX * tileSize < x0 + width; tileX++) {
		result += `<img src="https://tile.osm.org/14/${tileX}/${tileY}.png"
		style="position: absolute; left: ${tileX * tileSize - x0}px; top: ${tileY * tileSize - y0}px;"
		alt="" />`;
	}
}

result += "</div>";
Et voilà:


Map of Berlin
In Part 2, we’ll look at how to zoom in and out of our map.
Footnotes:
Footnotes
-
We directly used the decimal degrees instead of degrees, minutes, and seconds. ↩